Nashville’s Metro Council passed legislation Tuesday requiring the city’s police to provide quarterly use of force reports to the body.
Although much of this information is already available in an online, public dashboard, the reports will take the data a step further, offering more specific details about the individual who was subjected to use of force and whether the officer was within police policy.
Earlier this year, MNPD requested more money — in the form of a $24 million contract — to outfit the department with new Tasers. The Metro Council ultimately rejected the proposal. But, the ask prompted Councilmember Delishia Porterfield to visit the dashboard. She was alarmed by what she saw:
“I started looking at the data, when Tasers were being used,” Porterfield said. “It looks like it’s disproportionately being used on people of color in Nashville.”
She was also concerned by what was left out of the data — like specific ages for minors. While the dashboard does break down the demographics of use of force subjects, it uses ranges for age.
“There’s a big difference if you’re tasing a 10-year-old or 17-year-old, so that’s something that I really wanted to dig into,” Porterfield said.
Porterfield brought legislation to the council to require reports provided directly to the council. These will include:
- demographic information for subjects (age, gender, ethnicity)
- specific age of minor subjects
- number of instances a firearm was displayed or discharged by an officer, in addition to another use of force
- number of incidents where subjects suffered injuries in relation to the use of force, and the whether these incidents were in compliance with police policy
- when a Taser is used, the total taser discharges and the average number of taser cartridges used per incident
MNPD — who Porterfield worked with to craft the bill — already presents the council with reports pertaining to crime and traffic stops. Now, after the bill passed its third and final reading on Tuesday, use of force reports will be provided as well, four times a year.
What information is available on the dashboard?
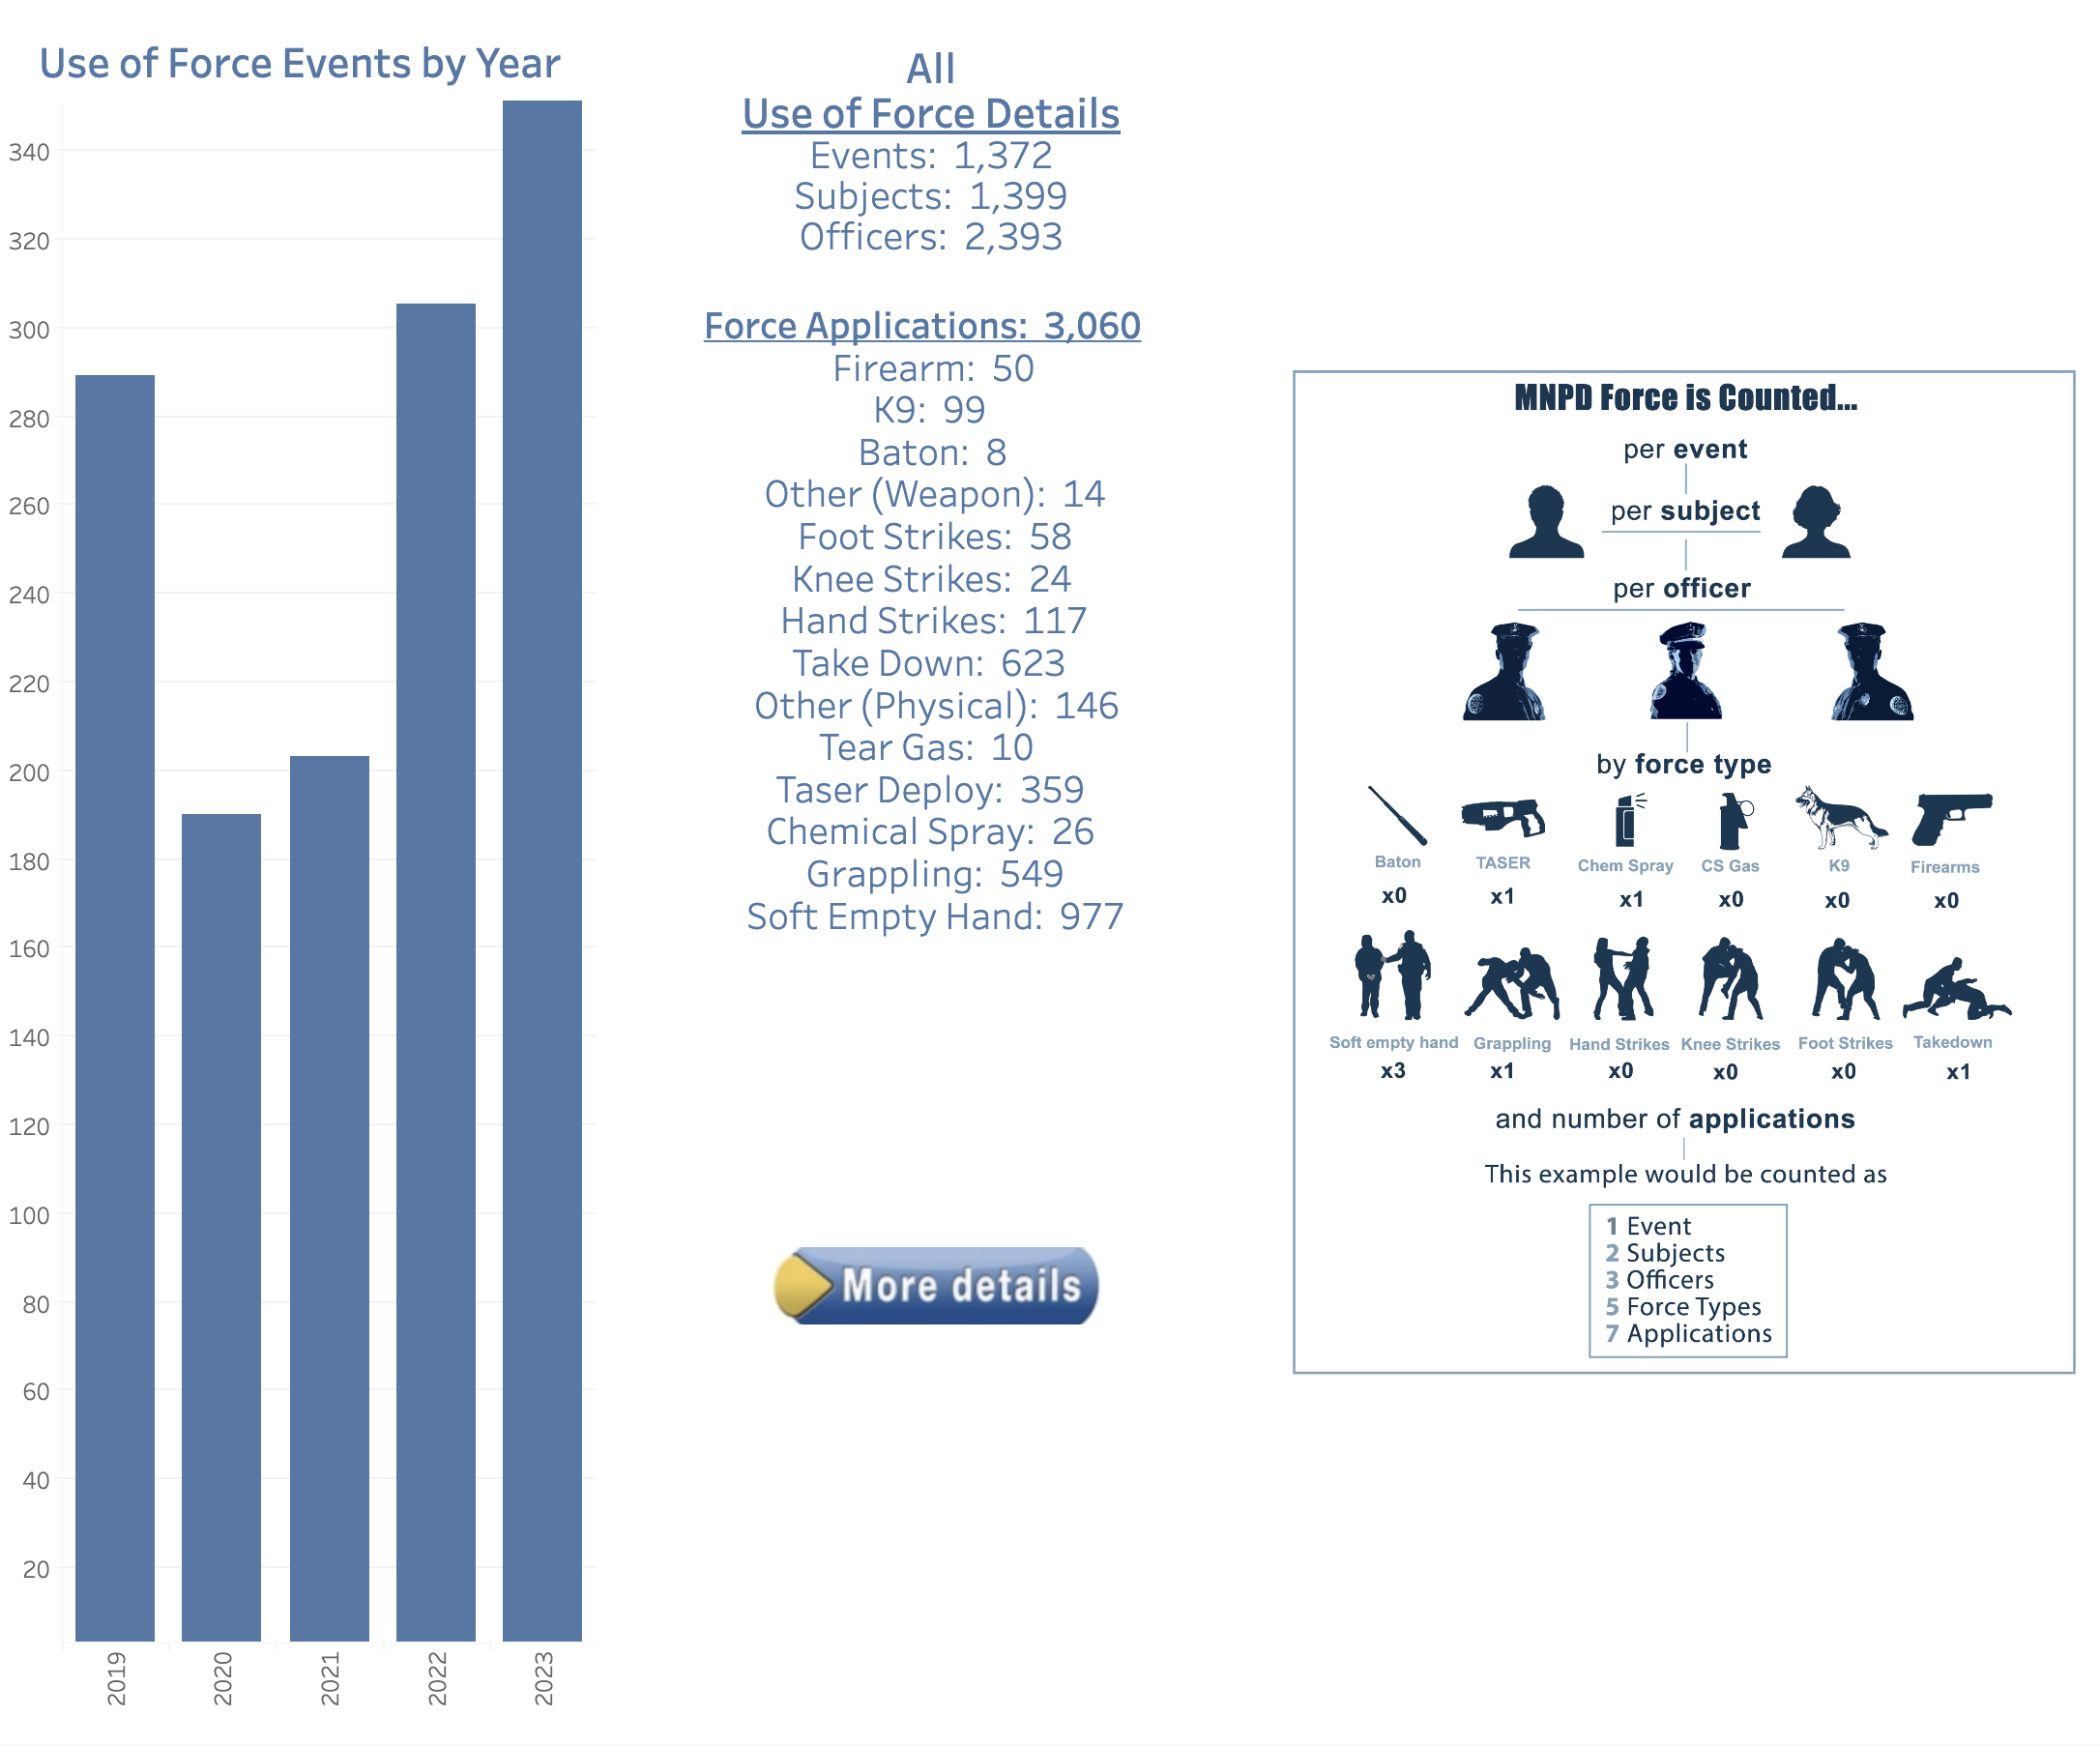
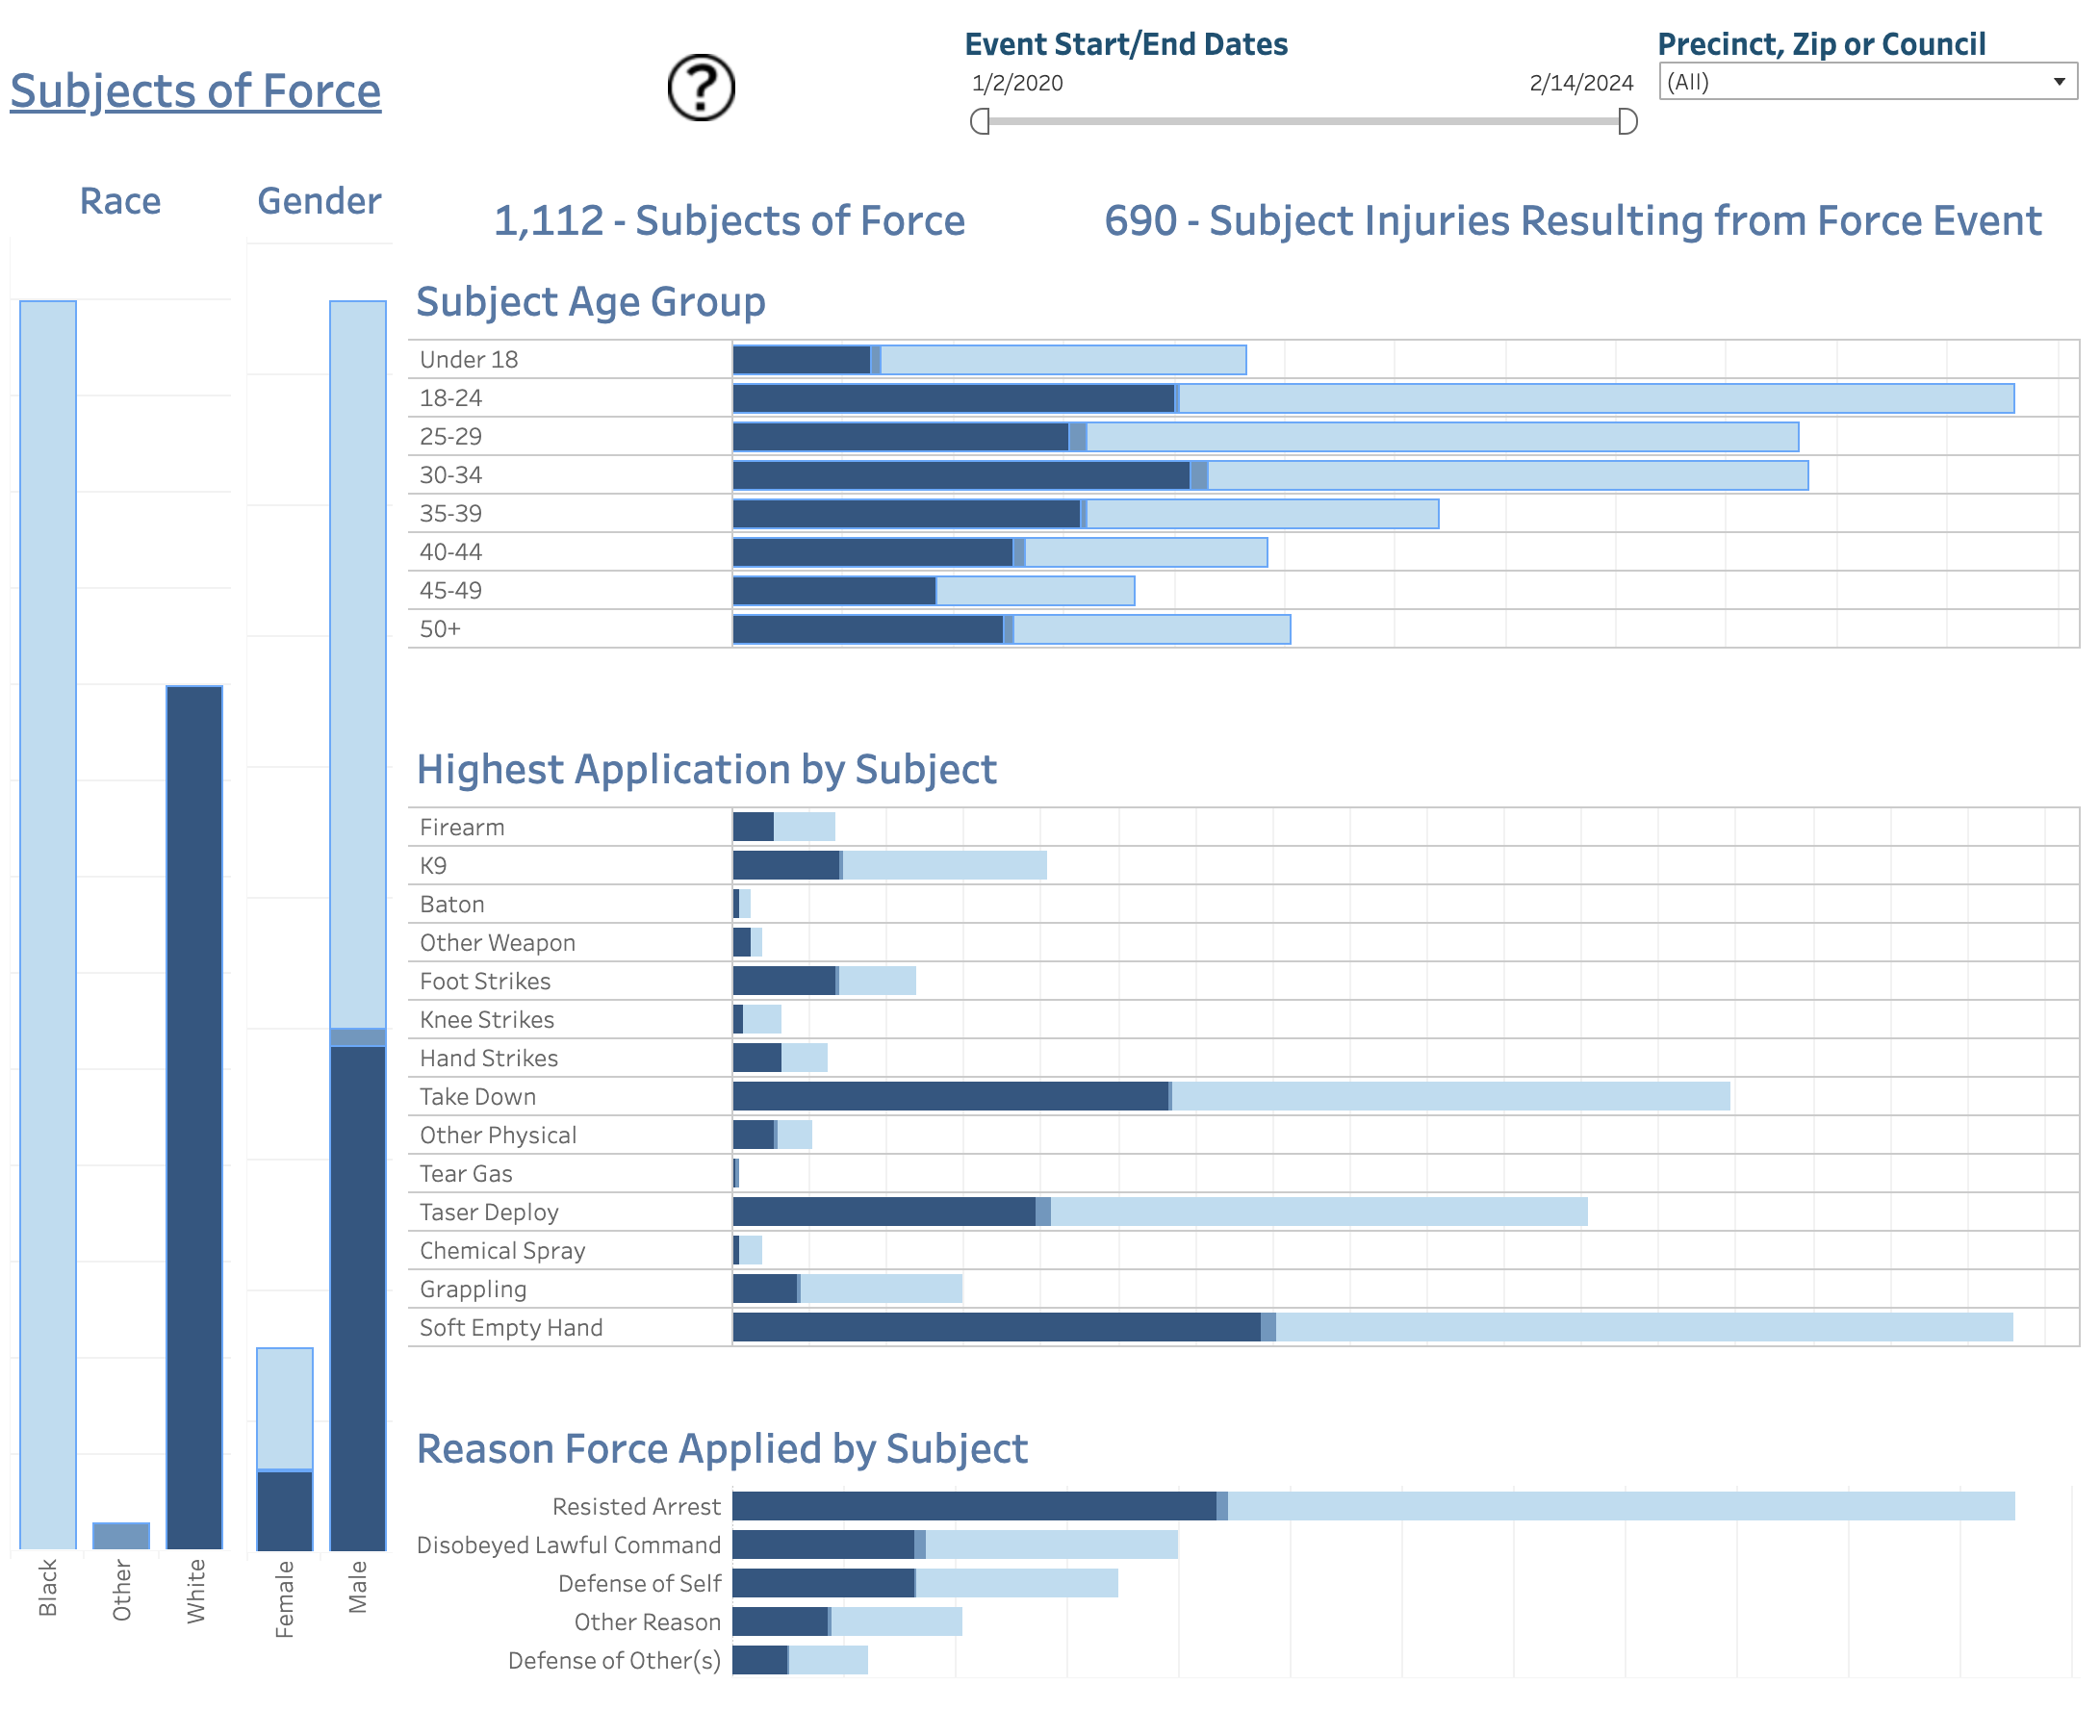
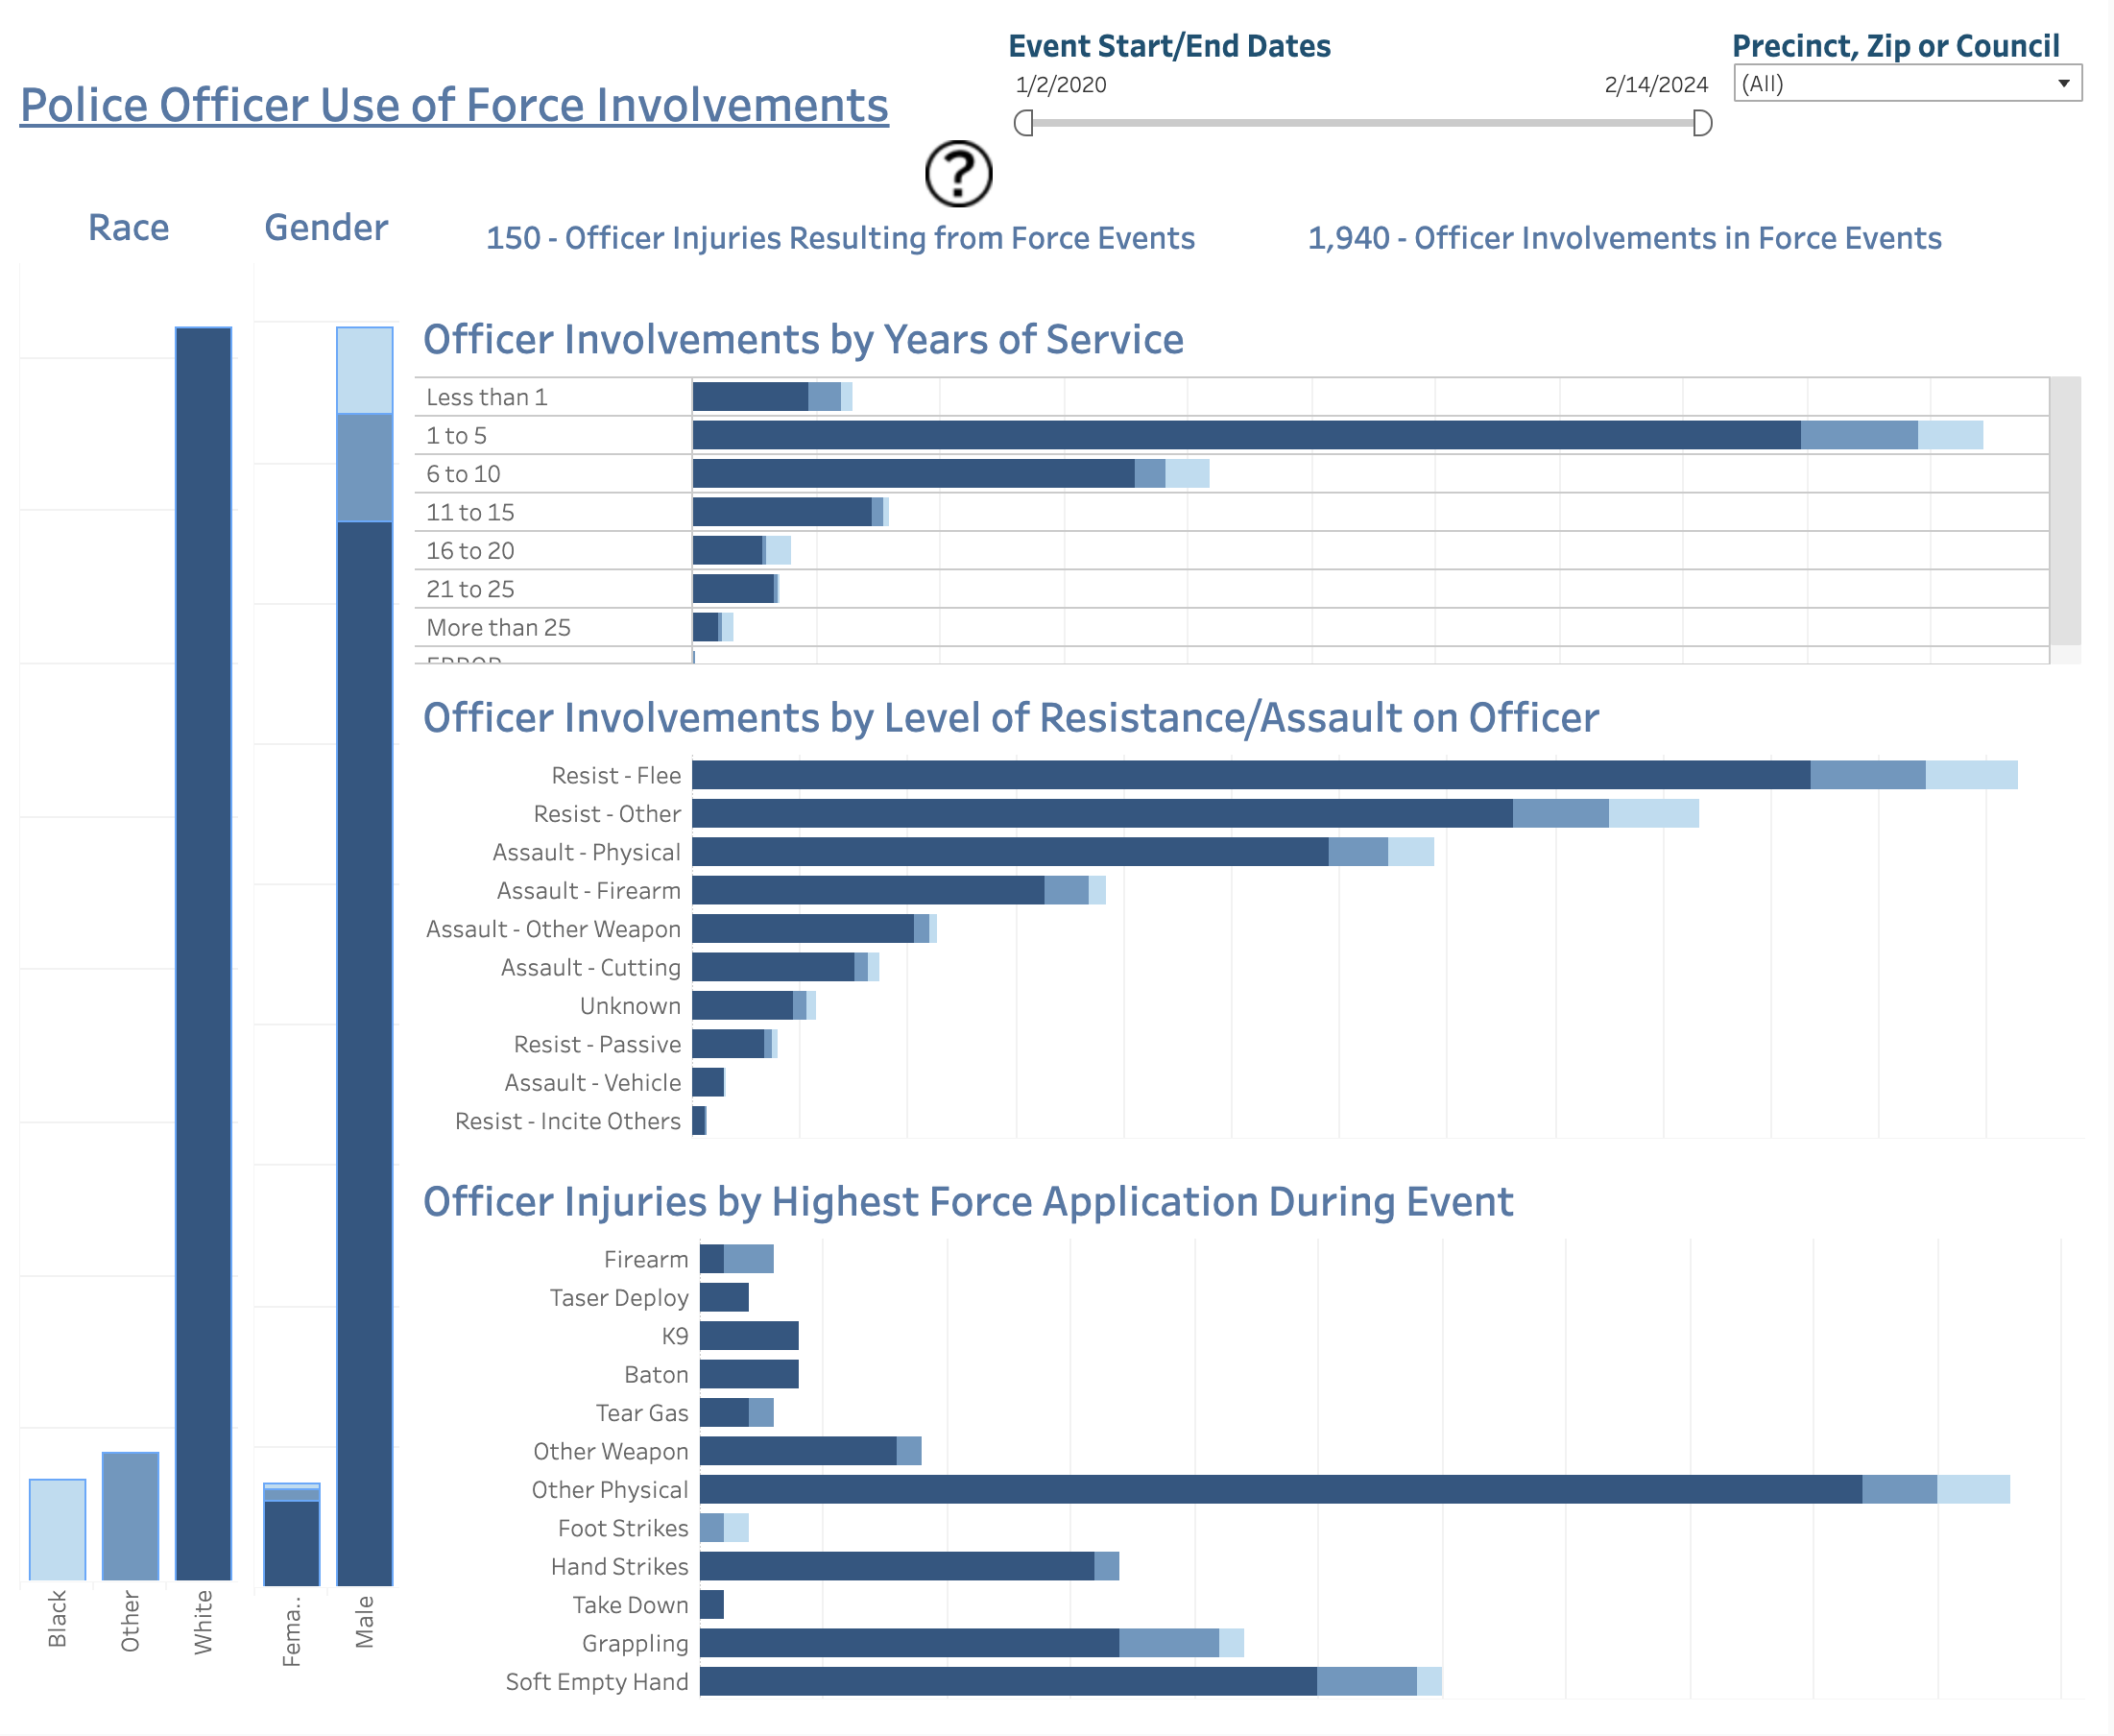
Online, use of force incidents are broken down by year, by subject and by officer. It includes data from the beginning of 2020 to February 2024.
“Use of force” can mean many things: use of firearms, K9s, batons, other weapons, foot strikes, hand strikes, knee strikes, take downs, other physical action, tear gas, Tasers, chemical sprays, grapplings, and soft empty hand restraints.
For MNPD, the most frequent type of force utilized is a soft empty hand restraint — which the use of force continuum describes as an officer using grabs, holds and joint locks to restrain an individual — followed by take downs and Taser usage.
The dashboard also includes things like the top reason force is applied (resisting arrest), the most common age range of individuals subjected to force (18 – 24), the most common race of subjects (Black), the most common race of officers using force (white), and how many years officers have been serving in the department (the majority of officers using force have been in the department between one and five years).
The dashboard also includes subject injuries from use of force events (690) and officer injuries (150).
Data can also be limited to particular date ranges or precincts, zip codes or council districts.


